About Us
It is a long established fact that a reader will be distracted by the readable content of a page when looking at its layout.

It is a long established fact that a reader will be distracted by the readable content of a page when looking at its layout.


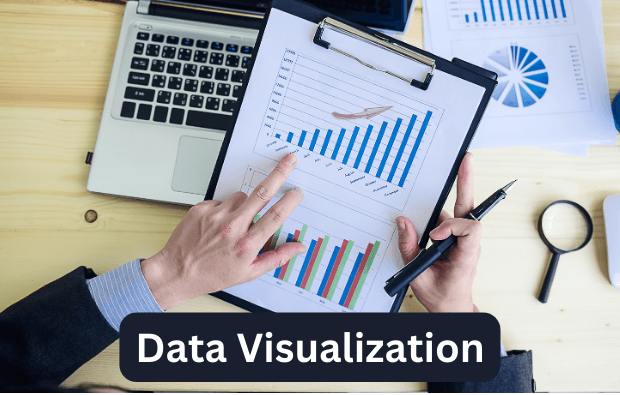
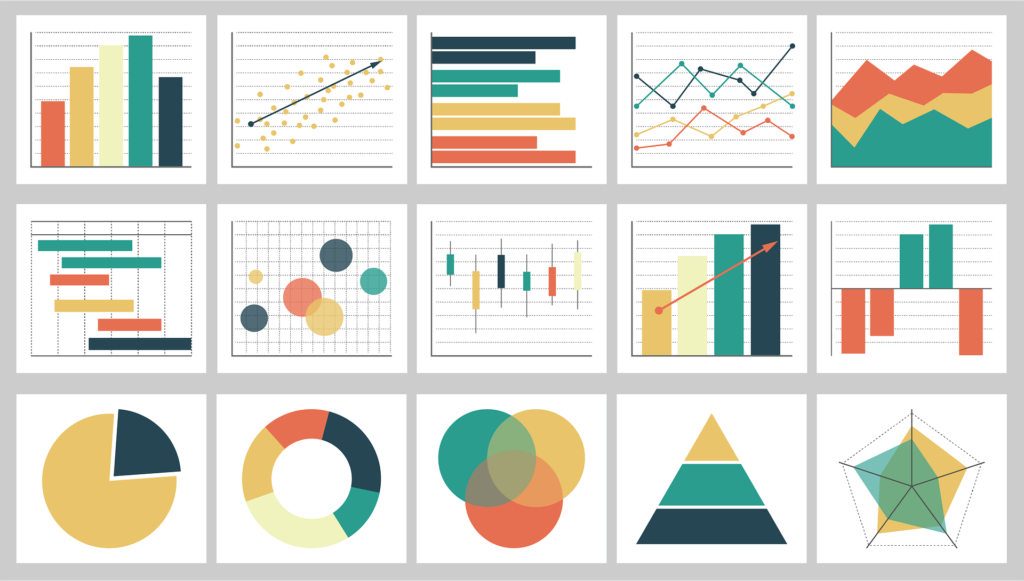
The graphic depiction of data and information is called data visualization. Data visualization tools offer a straightforward approach to observing and comprehending trends, outliers, and data patterns by utilizing visual components such as charts, maps, and graphs.
Data visualization in the form of dashboards is the go-to tool for numerous businesses to share and analyze information to make data more accessible and intelligible.
Moreover, it is an excellent tool for business owners and employees to clearly present data to non-technical audiences. To analyze large data volumes and make data-driven choices, data visualization tools, and technologies are crucial in the era of big data.
In today’s data-driven world, having accessible ways to visualize and understand data is crucial. Data skill is a necessary factor to consider in employees with every passing year. Every level of business owner and employee should comprehend data and its implications.
Data visualization is one of the most beneficial professional skills for decision making and progress. The more effectively you can use that information through a slide presentation or a dashboard, the better. The intersection between analysis and visual storytelling is where data visualization lies.

Data visualization is significant because it makes it easier for people to view, interact with, and comprehend data. Regardless of the level of expertise, the proper visualization, whether simple or complex, can put everyone on the same page.
One can’t imagine a professional industry that will not gain from better data comprehension. Understanding data benefits all STEM areas and those in the public sector, business, history, marketing, consumer goods, sports, and many more.

We are firm believers in data visualization capacity for transformation. In a saturated world of information, the ability to present complex data in an understandable and aesthetically appealing way brings informed decision-making and innovation.
Let us present the compelling reasons to choose us for our data visualization services:
In our visualizations, beauty meets functionality. We combine an artistic flair with a user-centric approach, creating visualizations that captivate and effortlessly communicate the intended message to your audience.
Our visualizations are not just eye candy; they are tools for decision-making. We enable you to make informed choices swiftly, identify trends, and unearth hidden patterns by presenting data clearly and intuitively.
Our interacting data visualizations allow your audience to explore data from different angles and draw conclusions. This encourages engagement and empowers your stakeholders to extract the insights that are valuable to them.
Our top priority is your satisfaction. How our visualizations bring success to your business is what matters to us. Our goal is to celebrate your success story.
We understand that time is of the essence. Our efficient project management processes ensure that your data visualizations are delivered within time without compromising quality.
Get in touch with our experts today to experience the power of insightful visualizations like never before